Introduction
Getting an "Exit Code 1" error in Kubernetes is common and can be frustrating for developers. If you see this error, it means that something is wrong with your containerized application. In this article, we will get into the details of this error, look at some of the most common scenarios that cause it, and then give you a step-by-step plan for fixing it.
Also, we will share with you some of the best practices to ensure that you identify and resolve this error swiftly. But first, let's start with understanding what exactly is an exit code and what is the significance of exit code 1.
Steps we'll cover:
- Understanding Exit Code 1
- Initial Steps for Troubleshooting
- Advanced Diagnostic Techniques
- System and Network Considerations
- Best Practices to Avoid and Fix this Error
Understanding Exit Code 1
What is an Exit Code
Like on any Unix-like system, when a process inside a Kubernetes container stops running, the container will send an exit code to the Kubernetes system. An exit code of 0 typically indicates success, whereas any value other than zero, such as 1, indicates an error.
The presence of exit code 1 is typically indicative of an error. It says something went wrong with the execution of the containerized application but doesn't say what.
Common Scenarios Leading to Exit Code 1
Application Runtime Errors: Execution errors, such as a runtime exception or the failure to finish a critical task, can cause your application to exit with code 1. The application's internal tests typically discover that it is unable to operate properly, which leads to this.
# Example Python snippet: Exiting with code 1 on a failed condition
    if not critical_service_available():
        print("Critical service is not available. Exiting.")
        exit(1)
Container Configuration Issues: Misconfiguration in your container's command or arguments can lead to immediate termination. For example, if the command you specified in your container spec doesn't exist or is incorrectly spelled, the container will exit with code 1.
#Kubernetes YAML snippet with a typo in the command
    containers:
    - name: myapp
      image: myapp:latest
      command: ["/bin/sh", "-c", "exitt 1"]  # 'exitt' is a typo
Failed Health Checks: Kubernetes can terminate a container that fails its liveness or readiness checks repeatedly. While this often leads to restarts rather than a direct exit code 1, it can contribute to a situation where the container is unable to stay running.
Dependency Issues Inside Containers: If your containerized application has dependencies that are not met (e.g., missing libraries, inaccessible external services), this can cause the application to exit with code
Resource Limit Constraints:
Containers in Kubernetes have resource limits, and exceeding these can lead to termination. However, this usually results in an OOMKilled error rather than an exit code 1, unless your application is explicitly designed to handle such scenarios with a custom exit code.
Improper Signal Handling:
If your application doesn't handle termination signals (SIGTERM) properly, Kubernetes' attempts to gracefully shut down the container might result in an abrupt exit with code 1.
Initial Steps for Troubleshooting
Checking Container Logs for Immediate Clues
Containers that exit with exit code 1 should be troubleshooted by checking their logs. Logs often contain container process output and can reveal why the process exited. Execute the command kubectl logs to view container logs:
kubectl logs <your-pod-name>
Replace <your-pod-name> with the name of your pod. If your pod has more than one container, specify the container name.
    kubectl logs <your-pod-name> -c <pods'container-name>
  Here is an example output of the above command:

      Error: Invalid configuration
        at /app/server.js:20:21
        at Layer.handle [as handle_request] (/app/node_modules/express/lib/router/layer.js:95:5)
        ...
    Process exited with status code 1
This output indicates that there's an issue with the configuration, which is a good starting point for further investigation.
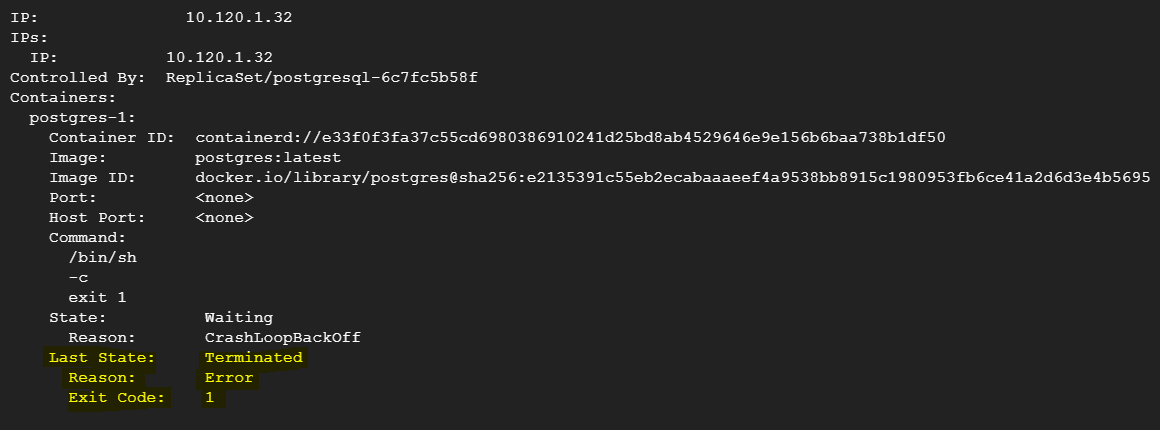
Expert tip: A container exiting multiple times with a non-zero exit code, such as exit code 1, can lead to a CrashLoopBackOff state in Kubernetes. If you look at the below error logs, you can see CrashLoopBackOff which was caused because the container exited many times with exit code 1.

Verifying Container and Application Configurations
Sometimes incorrect container or application configuration causes the error. Check your Kubernetes manifests and application configuration files. You can use the below command to see the details of your Kubernetes deployment:
kubectl get deployment <your-deployment-name> -o yaml
To see configuration of a particular pod:
kubectl get pod <your-pod-name> -o yaml
Look out for any misconfigurations in environment variables, command arguments, or volume mounts.
Expert Tips:
To check the logs for a pod that has exited with an error, use the kubectl logs command as described above. Additionally, you can check the events associated with the pod for any anomalies leading up to the termination:
kubectl describe pod <pod-name>
This command provides detailed information about the pod’s lifecycle events, including errors leading to termination. The below screenshot is what you might see in the output:

Advanced Diagnostic Techniques
A. Application-Specific Debugging Tools
Each programming language or framework comes with its own set of debugging tools that can be leveraged to understand the nature of the error.
Example for a Node.js Application:
    # Install node inspect in the container and start the application with the inspect flag

    kubectl exec -it <pod-name> -- npm install -g node-inspect
    kubectl exec -it <pod-name> -- node --inspect-brk=0.0.0.0:9229 app.js
Remember to expose the debugging port in the Dockerfile and Kubernetes deployment if not already done.
    #Dockerfile snippet
    expose 9229
Below is example snippet for YAML file:
      #Kubernetes deployment snippet
            ports:
            - containerPort: 9229
              name: debug
              protocol: TCP
B. Network and Dependency Checks
Check if the application's connection to external services or databases is properly configured. You can use kubectl exec to run network checks from within the pod.
Example:
    # Check if the database is reachable

    kubectl exec <pod-name> -- nc -zv <db-service-name> <db-port>
If using an ORM or database client, enable verbose logging to capture detailed connection errors.
// Example for a Node.js application using Sequelize
const sequelize = new Sequelize('database', 'username', 'password', {
  host: 'db-service-name',
  dialect: 'mysql',
  logging: console.log,
});
C. Container Environment Issues
Issues related to the container environment like Docker or Kubernetes can lead to exit code 1.
- Common pitfalls include:
- Misconfigured environment variables
- Incorrect file paths or permissions
- Resource limits being hit (memory, CPU)
To diagnose these, check the container logs and describe events, use below mentioned command:
    # Retrieve the logs of the terminated container

    kubectl logs <your-pod-name> --previous
Common Pitfalls in Container Setup
Environment Variables: Ensure that all required environment variables are set. You can check the current environment variables with below command:
kubectl exec <your-pod-name> -- envBelow screenshot shows all the env variables for a PostgreSQL installation.

File Permissions: If your application reads from or writes to files within the container, permissions might cause issues.
    # Check file permissions through below command
    kubectl exec <your-pod-name> -- ls -l /path/to/check
- Resource Limits: Kubernetes allows you to set resource limits on your containers. If these are too low, your application might be terminated.
  # Kubernetes deployment snippet to set resource limits
    resources:
      limits:
        cpu: "1"
        memory: "1024Mi"
System and Network Considerations
An application-level error is indicated when a Kubernetes pod terminates with the error 'Terminated with exit code 1'. However, it's critical to look into problems at the system and network levels that might be indirectly causing this issue.
System-Level Logs
First things first: look in the system logs. Lack of resources is a typical reason for abrupt termination. Steps:
- Find the Kubernetes node where the pod is running.
- Use command
kubectl describe node <node-name>to get a summary of the node's status. - Check for any events or conditions indicating resource bottleneck.
- Check individual resource usage through below command:
- Memory:
free -h - CPU:
toporhtop - Disk:
df -h
- Memory:
Tip: Pay close attention to OOMKilled events, which indicate the pod was killed due to Out Of Memory.
Screenshot/Config Required: Capture a screenshot of the system log where any resource-related issues are clearly indicated. For instance, if the dmesg or /var/log/syslog logs show Out of memory: Killed process, it's a definite clue.
Network Configuration
Next, examine the network configuration, as these can disrupt communication with the pod or between the containers.
Steps:
- Verify the network policies in Kubernetes by running the below command:
kubectl get networkpolicies --all-namespaces
- You need to make sure that the pod's network interface configuration aligns with the cluster's network.
- Check if there are any firewall rules on the node that are blocking the traffic. Use below commands to verify that:
sudo iptables -L -nsudo ufw status
Expert tip: Keep eye on the dropped packets in the firewall logs or use tcpdump to trace network packets.
Firewall Rules
Firewalls can also block traffic that your application needs to route. You need to make sure that your firewall rules are not in conflict with the network requirements of your application.
Steps:
- List current firewall rules with
iptablesor your firewall management tool. - Cross-reference the required ports for your application with the allowed ports in the firewall.
- Check for any recent modifications in the firewall rules that coincide with the onset of the issue.
To list iptables rules, the following command can be used:
sudo iptables -S
Best Practices to Avoid and Fix this Error
- Validate Container Entrypoint: Ensure the container's entrypoint script is executable and has the correct shebang line (
#!/bin/bash). A common error is 'No such file or directory' if the entrypoint is not found or not executable. - Check Application Dependencies: Verify all required libraries and dependencies are present. Missing dependencies often lead to '
Library not found' errors within the container. - Inspect Application Code: Review recent code changes for possible mistakes. Errors such as '
Undefined variable' or 'Syntax error' in logs often point to new code issues. - Utilize Liveness Probes: Configure liveness probes in Kubernetes. Pods frequently restarting, as shown by
kubectl get events, suggest failing liveness checks. - Analyze Logs: Use
kubectl logs <pod-name>for immediate error output. 'Permission denied' messages could indicate execution permission issues. - Monitor Resource Usage: Set up alerts for memory and CPU to catch overuse. Pods terminated with '
OOMKilled' status have exceeded their memory limits. - Handle Signals Gracefully: Ensure your application handles signals like SIGTERM for proper shutdown. Logs stating '
Signal received: SIGTERM' without a graceful exit can mean improper signal handling. - Avoid Hardcoded Paths: Use relative paths or environment variables instead. '
File not found' errors often occur due to hardcoded paths that don't exist in the container's filesystem. - Use Init Containers: Leverage init containers to ensure the environment is correctly prepared before the main application starts. Failure logs in
kubectl describe pod <pod-name>for init containers indicate issues with environment setup. - Test Locally: Run your container locally to identify discrepancies. '
Environment variable not set' errors may arise due to differences between local and container environments.
Conclusion
In this article, we have walked through the most common causes of the "Terminated with exit code 1" error in Kubernetes and shown you how to fix them. Whether it is a careless typo in the YAML file, a resource bottleneck, or an application's internal error, you can follow the steps in this guide and get the error resolved. Remember that the most reliable systems are made through the mistakes and successes of fixing problems in the real world. Have fun fixing things!

